Introduction
The alignment of pairs of sequences or multiple DNA sequences (MSA) is essential in bioinformatics since it allows the study of the evolution of species, known as phylogeny reconstruction and the discovery of new pharmacological tools for human and animal health care. Due to the computational complexity of the alignment algorithms and because current computing equipment has more excellent processing and storage capacity, researchers use different strategies to improve the execution speed of the algorithms, such as the use of a Workstation, GPU/CPU cluster and other computing systems, so there are few hardware implementations, due to the lack of knowledge in the design of digital architectures on the part of researchers. As has been evidenced in the pandemic, sequencing and alignments of protein or nucleic bases have been fundamental in the creation of the different anti-SARS-CoV-2 vaccines, an achievement achieved by humanity through the study constant of varying test subjects, with the respective sequencing and alignment of the other strains using supercomputers, which shows that only the world’s economic powers can develop the most significant number of effective vaccines in the world.
Multiple DNA Sequence Alignment
A multiple DNA sequence alignment algorithm is an alignment algorithm that receives three or more sequences as input. Although dynamic programming appears to be attractive to be applied to the alignment of multiple sequences, there is a fundamental problem, and that is that, as discussed in the book [29], given k sequences, the size of the routes of each node increases to 2k − 1 corners or possible routes, obtaining a time complexity in capital O notation of O(nk ∗2k), therefore in a world where genetic information grows exponentially. The computational resources are expensive. Their use becomes impractical.
Heuristic Algorithms
An alternative to the scalable DP MSA algorithms for many sequences, which is most common in a practical scenario, is to use a heuristic algorithm, which is not guaranteed as a solution. It is optimal but has an acceptable complexity in terms of time. The execution algorithms for MSA are classified as progressive, iterative and hybrid.
Progressive
A progressive approach allows multiple alignments to be built gradually. Following the following series of steps:
- A pairwise alignment algorithm is used on the input sequences if they are not aligned in size (by dynamic programming, anchoring).
- The score or distance function between a pair of sequences is calculated (distance matrix).
- A method joins the sequences into the final alignment (guide tree).
- Use a sequence alignment method during the multiple alignment stage (profile alignment or alignments of alignments).
The multiple global alignment algorithms that adopt the progressive approach are fast, simple to implement, and require little memory space. However, they have two drawbacks:
- The restriction is that only two sequences are compared at a time.
- The alignment result depends on the order in which the sequences are combined and the scoring function selected.
Many global multiple alignment algorithms adopt the progressive algorithm: CLUSTALW, T-COFEE, DBCLUSTAL, MAVID, KALIGN, PRALINE, SPEM, EXPRESSO, PSALING, COBALT, PROMALS, and GRAMALIGN.
Iterative
Algorithms that adopt this approach construct an initial alignment during each iteration, working with a set of modifications on the current alignment to construct a new one. The iteration is repeated until converging on the final alignment. The steps necessary to implement this type of algorithm are:
- A break is made as an insertion/deletion of one or more gaps in the alignment.
- One or more sequences are excluded from the initial alignment. The residue sequences are realigned, and finally, the new alignment is aligned with the excluded sequences.
- The alignment is divided into two groups, then a profile is built for each alignment, and finally, the two profiles are aligned.
Furthermore, the iterative approach is appropriate for stochastic and genetic algorithms. The algorithms improve the alignment quality but require more execution time than the progressive approximation. Some multiple sequence alignment algorithms that adopt the interactive method are HMMER, SAM, SATCHMO, SAGA, QOMA, and FSA. Additionally, the execution time of SAM and SATCHMO is O(n2 ∗ k ∗ I) and O(n2 ∗ k2 +n ∗ i2), respectively, where k is the number of sequences, n is the size of the sequence, and i is the number of iterations in the alignment.
Hybrid
The approach of progressive algorithms, which apply a refinement stage, is called hybrid algorithms; these improve the local alignment of the nucleotides of the alignment. Some algorithms that include this strategy are MUTALIN, PRRP, MULTI-LAGAN, MUSCLE, PROBCONS, MAFFT, AND MSAID.
Algorithm MAFFT
The MAFFT algorithm has drastically reduced the computational complexity compared to other existing methods. This was thanks to the implementation of the following techniques in the alignment:
- Rapid identification of homologous zones using the fast Fourier transform.
- A new, simplified scoring system that works well with reduced computational complexity.
In the research, two heuristic methods of the MAFFT algorithm were implemented: the purely progressive algorithm FFT-NS-1, and the hybrid progressive algorithm FFT-NS-2.
MAFFT Algorithm Software Implementation
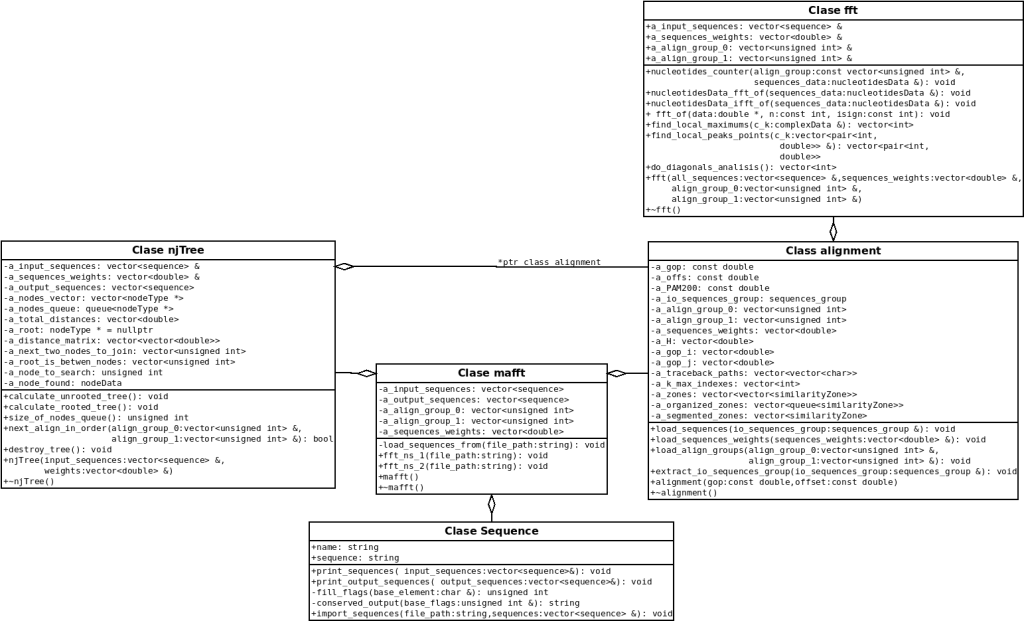
The design and implementation of the software focused on the object-oriented programming paradigm. The method consequently allows the different components of the algorithm to be abstracted, which facilitates error debugging and sacrifices the development speed due to the need for more excellent planning time. On the other hand, the classes designed for the FFT-NS-1 and FFT-NS-2 algorithms are composed of a series of objects focused on the principle of modularity (a single function per class and more methods). Consequently, the objects are structured as seen in the UML diagram.
System Integration and Analysis Results
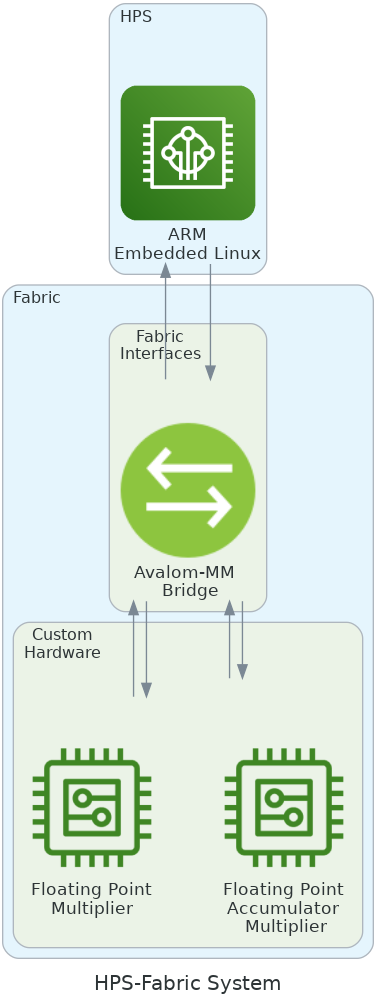
As you can see, the proposed system in the figure is composed of three components: first, the Hard Processor System (HPS), the ARM processor of the SoC-FPGA system running the leading software under embedded Linux, and second, the communication protocol. Between the fabric and the HPS, configured in Avalon-MM, and the custom accelerator blocks for the MAFFT algorithm.
Result Analisys
Different tests to check the hardware performance are presented, emphasizing hardware consumption, processing speed and energy consumption. The materials used during the performance tests were:
- FPGA-SoC: DE10-Nano Kit.
- Computer: DESKTOP HP PAVILION GAMING 690-002BLA. • Intel Quartus Prime Standard Edition Design Software Version 19.1 for Linux.
- Intel SoC FPGA Embedded Development Suite Standard Edition –Software Version 19.1 for Linux.
- DNA (Orchid family) Orchidaceae Genomes – NCBI Datasets.
- Reference benchmark for DNA alignments based on the tertiary structure of proteins.
Area consumption
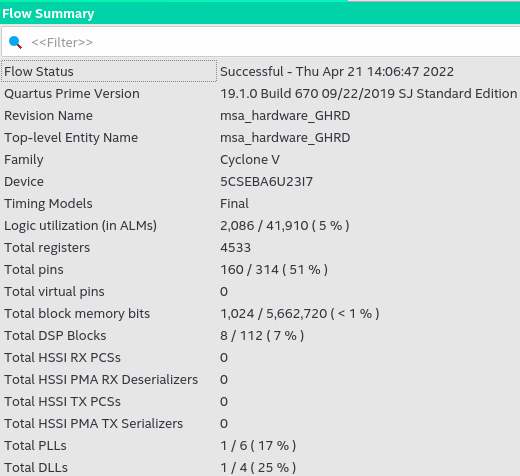
As seen in the figure, the compilation report of the software-hardware system in Quartus Prime, the system as a whole has consumed a total of 2,086 logical blocks used, a total of 4,533 registers, 160 device pins, 1,024 bits of total block memory, 8 DSP blocks, 1 PLL, and one clock reference DLL. The PLL and DLL block were necessary to raise the clock frequency from the generic 50Mhz for the development board to 125Mhz, the maximum frequency achieved for the project hardware.
Energy Consumption
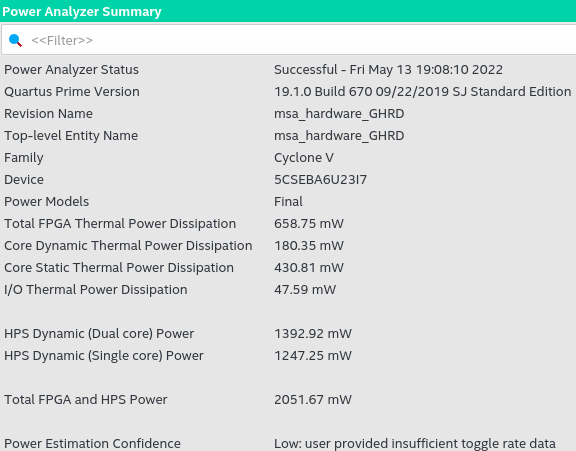
The Quartus Prime power consumption report, see figure, emphasizes that confidence in the data is low due to missing data about the rate of data change in the system. However, the approximate power consumption only in the FPGA system is 658.75mW, and because the HPS uses the Linux operating system, the default configuration is Dual Core, so the consumption is indifferent if used. The algorithm sequentially or threads is 1, 392.91mW generating a consumption of approximately 2,051.67mW in the FPGA-HPS system. Considering the energy consumption analysis in the figure, with a consumption of 2 051.67mW, it is many times lower than the desktop computer used for testing, which has a consumption of approximately 24W without work and 125W when low. Stress. The difference in consumption is due to the architecture of the ARM A9 processor of the FPGA-SoC and the small area used, according to the report.
Hardware Performance
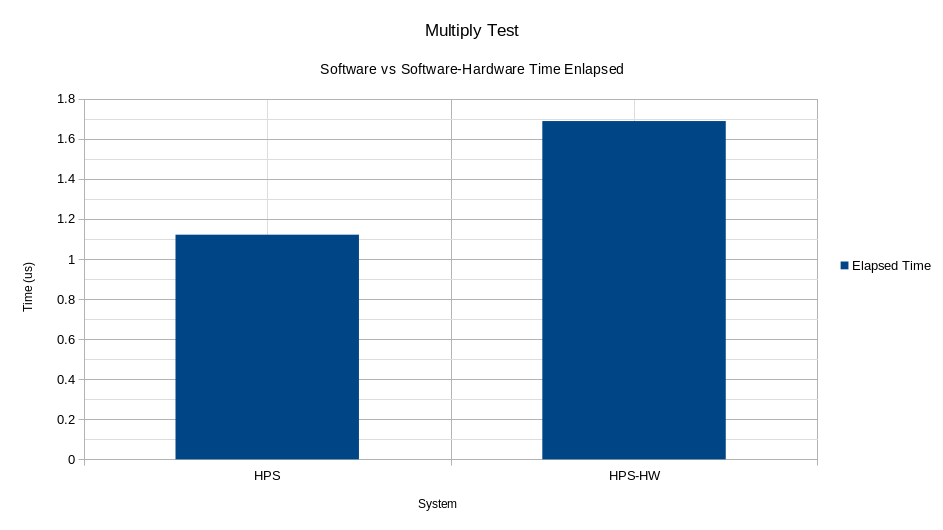
The process to test the operating speed of the Multiply block consists of creating a vector of 2,000 IEEE754 64-bit data (double in C++) randomly to introduce A and B as operators in the operation P = A ∗ B. By measuring each of the times elapsed in the operations, the average of all the times shown in the figure is calculated. As can be seen, multiplication in software is faster than the same operation in its hardware counterpart. The overwhelming gap between the two systems results from the frequency at which the HPS system works (ARM ) of the FPGA-SoC system is 800Mhz in contrast to the maximum 125Mhz achieved by the hardware multiplier.
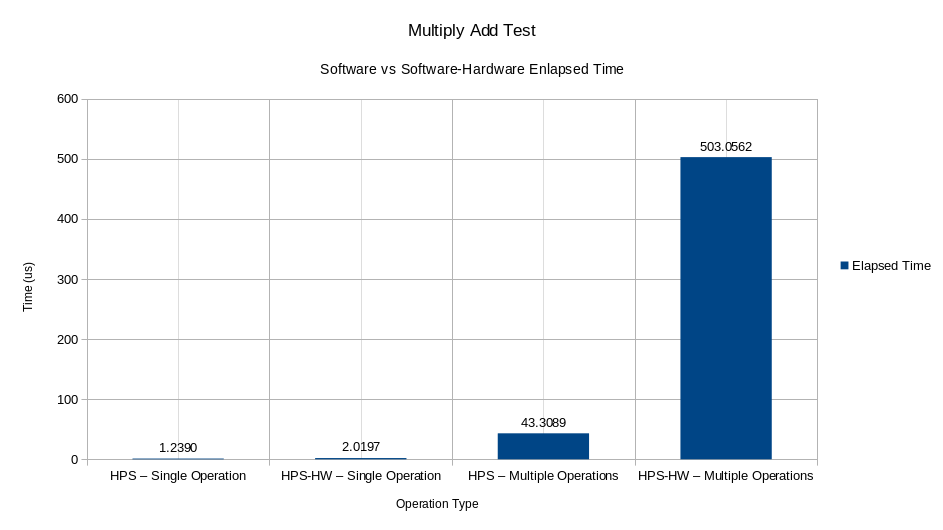
The speed tests for the Multiply Accumulator hardware comprise a vector of 3,000 random IEEE754 64-bit values (double in C++) to be introduced as operators in the function P = A∗B+C. The first test consists of directly entering the values A, B, and C, measuring the time elapsed between each operation. On the other hand, the second test consisted of entering the values of A and B, plus the instruction to accumulate, measuring the time elapsed each time the accumulation of the thousand data finished, and repeating the process a thousand times. Finally, the average time spent on each test can be seen in the figure. As seen in the figure, when an individual operation is performed with the hardware, the Multiply Accumulator consumes more time during processing than direct software multiplication with the HPS, showing that it is approximately 1.63 times faster than the device. On the other hand, when the accumulation of a thousand data between software and hardware is compared, the difference increases to approximately 11,615 times faster in HPS than in the software-hardware system.
MAFFT Algorithm Performance Test
For the development tests of the MAFFT algorithm, different datasets were created based on the original dataset DNA (Orchid family) Orchidaceae Genomes – NCBI Datasets. The test generates different datasets with combinations of sequences 2, 4, 8, 16, and 32 with base quantities of 100, 200, 400, 800, and 1,600. Once all the combinations between sequences and bases are created, the alignment of each combination is calculated, and the time elapsed in each alignment is taken. The results of the study can be seen in the figures.
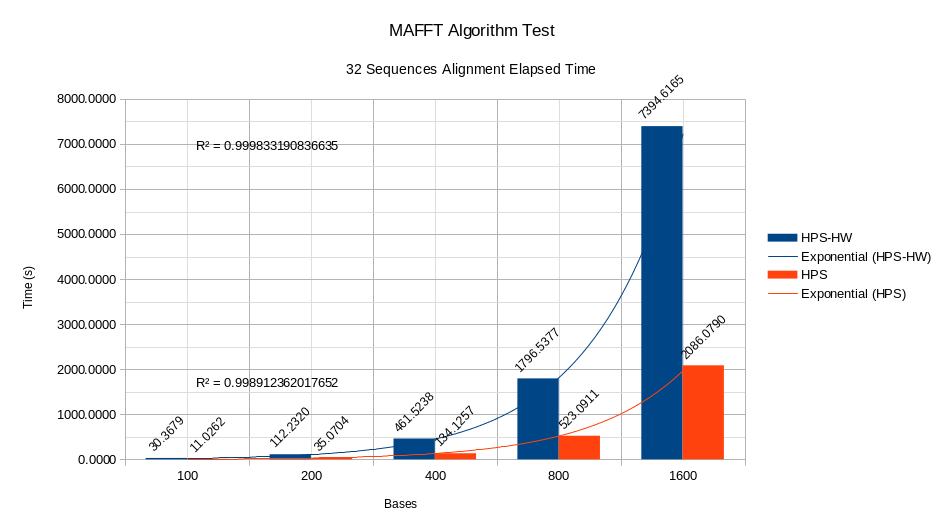
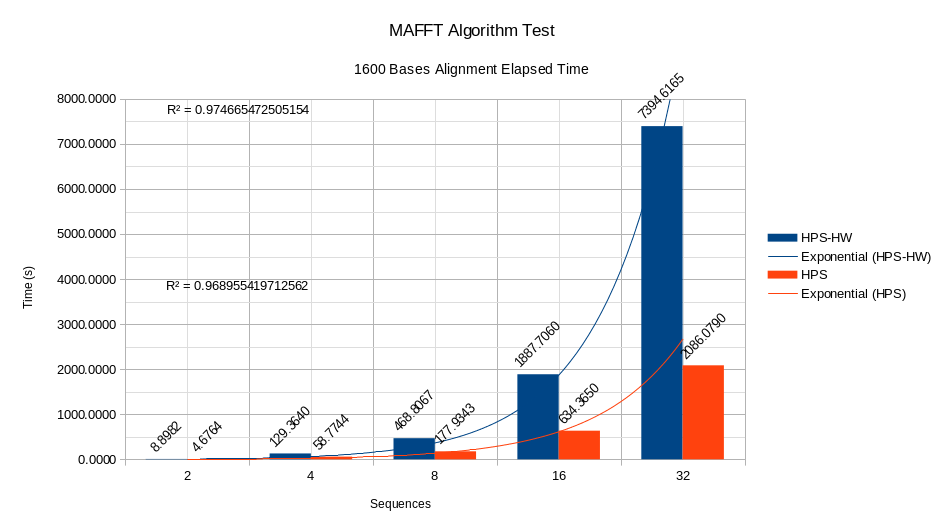
As seen in the figures, by maintaining a quantity of 1,600 bases in the stress test and increasing the number of sequences in each alignment, the algorithm works faster in software than in software coding. Hardware. Furthermore, the trend curves for the HPS and HPS-HW systems comply with an exponential behaviour in the relationship time per number of sequences, as demonstrated by the respective R2 values. The analysis for a fixed amount of 32 sequences and base variations 100, 200, 400, 800 and 1,600 is similar to the study in pictures where the HPS has a better behaviour than the HPS accelerator. HW, and exponential trends in the relationship between time and number of bases.
Algorithm Operation


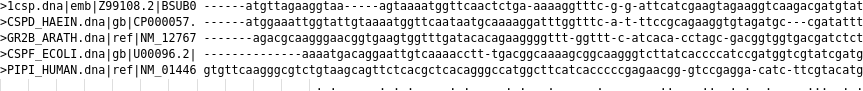
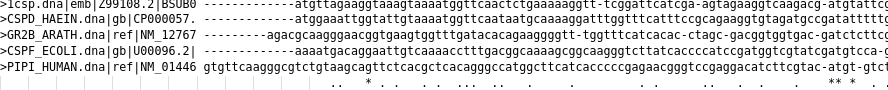
The aim is to test the operation of the MAFFT algorithm. For the test, the RV12 BBS12009.afa file is used. The test consists of 5 sequences, each between 201 and 207 nucleotide bases. The input sequences can be seen in the figures.
Construction of the Guide Tree
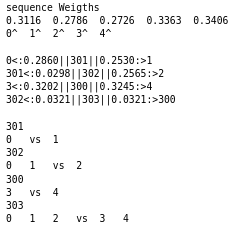
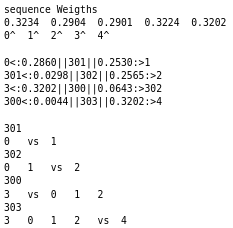
The first step of the FFT-NS-1 and FFT-NS-2 algorithms is constructing the guide tree, as mentioned in the theory; during the test, the guide trees generated for each algorithm can be seen in the figures. Because the FFT-NS-2 algorithm is a refinement process of the MAFFT algorithm, it is expected to perform better. The first detail to highlight among the generated guide trees is that the weights obtained in the first approximation by FFT-NS-1 concerning FFT-NS-2 are close but different. In addition, the connections of the phylogenetic tree change, altering the alignment order.
Alignment Output by FFT-NS-1
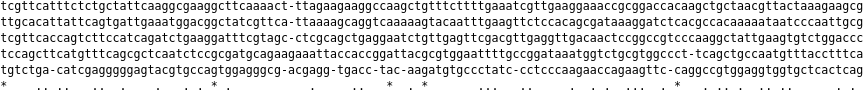
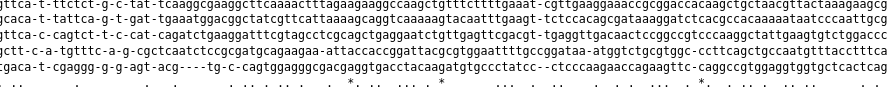
As a result of the order of the alignments and the weights obtained from the guide tree, the figure’s alignment is obtained. The alignment was obtained due to the insertion of 68 gaps, a total size of 217 bases in each sequence, with 60 semi-conserved zones and five conserved zones.
Alignment Output by FFT-NS-2
After using the result of the FFT-NS-1 algorithm to construct and obtain the new weights of the phylogenetic tree of the figure, the FFT-NS-2 algorithm 70 obtains the figure’s alignment. As a result of the insertion of 103 gaps, the sequences reach a size of 217 bases, with 66 semi-conserved zones and a total of 7 conserved zones. It can be concluded that the implementation of the FFT-NS-2 algorithm allowed us to obtain, for example, more semi-conserved zones and conserved zones than its counterpart FFT-NS-1. Furthermore, the size of the internal gaps in the sequence is reduced, presenting fewer information losses between the sequences.
Conclusions
- The hardware accelerator built for the MAFFT algorithm, compared to the algorithm only executed in software, made it possible to show that no significant speed improvement is achieved due to the system’s dependence on working with the IEEE754 64-bit standard for the calculation of the Needleman and Wunch algorithm. Consequently, MAFFT does not allow data streaming for the pair sum process or the similarity matrix, which is the best option according to the system’s time profiles.
- Unlike other progressive algorithms, such as those of the Clustal family, using the discrete fast Fourier transform in the MAFFT algorithm reduces the computational complexity in most alignments with excellent results. Furthermore, although the FFT allows for better data streaming according to the theory, the time profiles indicate that it is not the system’s bottleneck, so it was not selected as an objective. For the construction of the project accelerator.
- The algorithm’s main disadvantage is a considerable increase in bases in the DNA sequences; the points in the fast discrete Fourier transform must be at least double the number of bases in the alignment due to the points necessary in calculating correlations. Consequently, in large volumes of bases, the critical point of the Danielson-Lanczon algorithm for FFT can be reached where the maximum displacements are exceeded for the algorithm to generate computational advantages. One of the reasons why the Multiply and Multiply Accumulator devices have worse performance than the pure software ARM system of the FPGA-SoC device is that while the customized hardware reached a maximum frequency of 125Mhz, the processor operates at a default frequency greater than 800Mhz, approximately 6.4 times faster than the hardware devices built in the project.
- The consumption of the HPS and HPS-HW systems is low due to the ARM architecture of the FPGA-SoC device, which is designed for low-power devices and is the trim area used in the custom research hardware. As could be seen, as the number of sequences and bases in the alignments increases, the consumption of computing time grows exponentially, according to the R2 analysis of the results of the performance tests. Therefore, it is considered a problem that must be entirely resolved.